20+ Free PowerPoint and Google Slides Templates for Data Presentations

Graphs and diagrams are crucial in data presentations since they make complex information much more understandable. Imagine copying and pasting all 1,000 rows of data onto your slides and expecting your audience to understand it. It’s really hard, isn’t it?
Presenting your data analysis doesn’t have to be a struggle. These PowerPoint and Google Slides templates will significantly cut down your preparation time, allowing you to focus on ensuring the accuracy of your data analysis while we handle the design.
This article is divided into two sections: the first covers our free PowerPoint templates, and the second covers our free Google Slides templates. Oh, and in case you’re wondering, yes, you can use a PowerPoint template in Google Slides and vice versa.
PowerPoint Templates for Your Data Presentations
Let’s start with our data presentation templates in PowerPoint.
As you may know, PowerPoint is one of the best presentation software programs available today. So, take advantage of all its features with our free templates!
1. Playful Venn Diagram PowerPoint Template
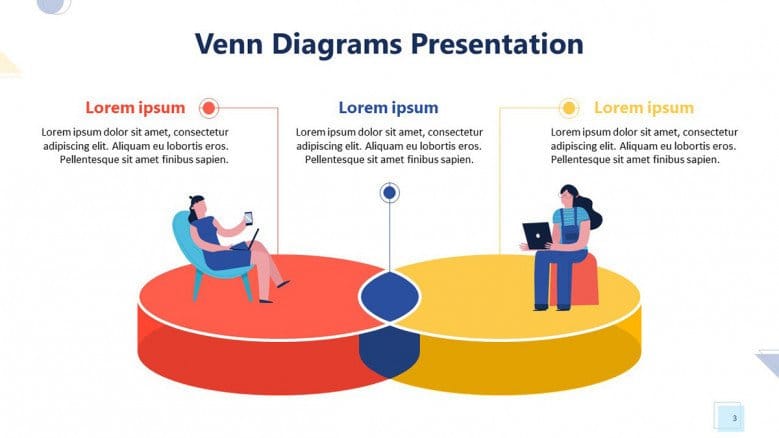
Venn diagrams show the similarities and differences between 2 or more data sets. Your audience can tell if there’s anything familiar between them just by looking at the diagram.
Likewise, if you want to emphasize the differences between data sets, Venn diagrams are great for that purpose, too. Now, for this template pack, you’ve got 10 slides to choose from. Pick your favorite!
2. Graph, Diagram, and Data Sheet PowerPoint Template
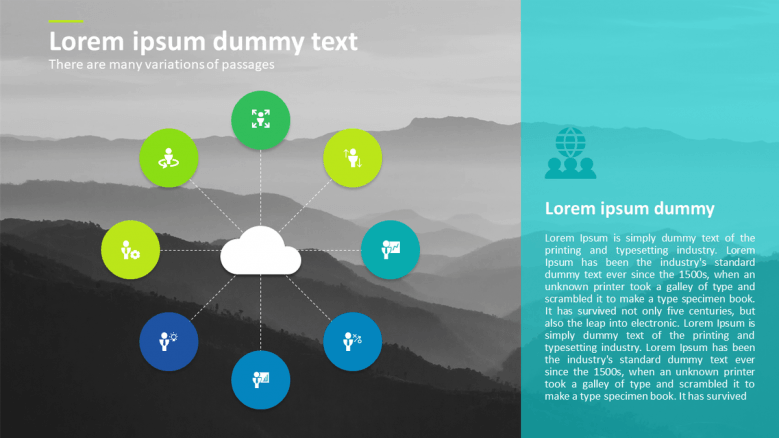
Using graphics is the best way to create data presentations, and at 24Slides, we know that!
If you’re looking for simple yet creative graphs, including a Gantt Chart in PowerPoint, this 5-slide template pack is perfect for you. Take a look at the previews and download the pack for free!
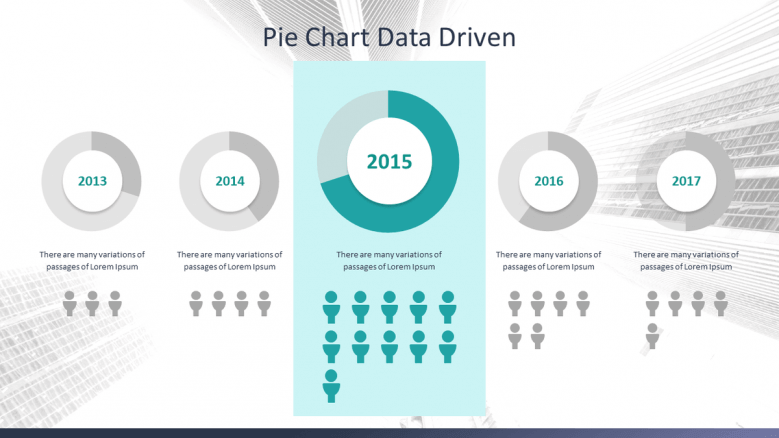
3. Generic Data-Driven PowerPoint Template
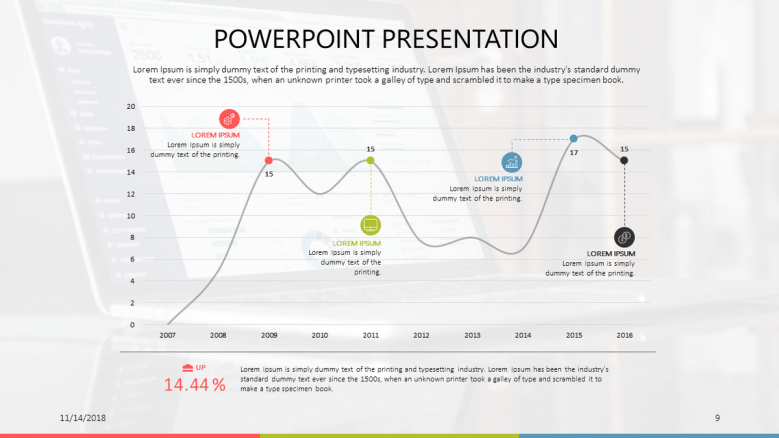
Here are more basic graphs for your presentation decks. This template can be used for many situations, including a job interview, a sales presentation, or even an academic one.
If you want to make the slides look even more unique, you can customize the background with some personal images.
4. Cockpit Chart PowerPoint Template
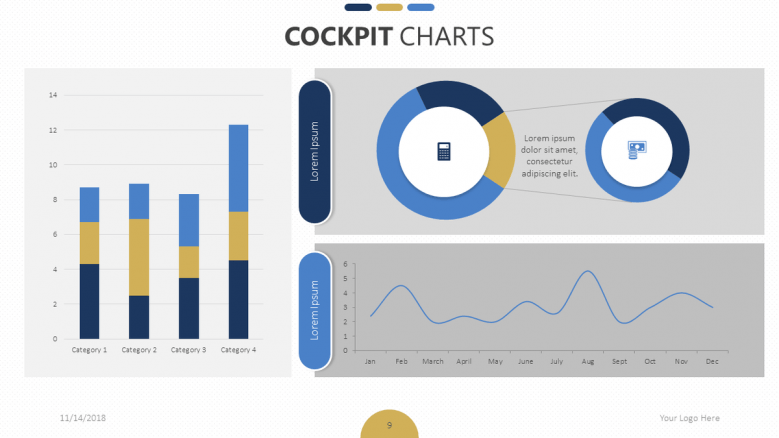
If you’re giving a high-level presentation to decision-makers who need to see complex data and proper analysis, then this free template pack is for you.
With this pack, each of the 9 slides brings a fresh example of charts and diagrams, ready to make your data come alive. Click on the title and pick the perfect one to captivate your audience!
5. Matrix Chart PowerPoint Template
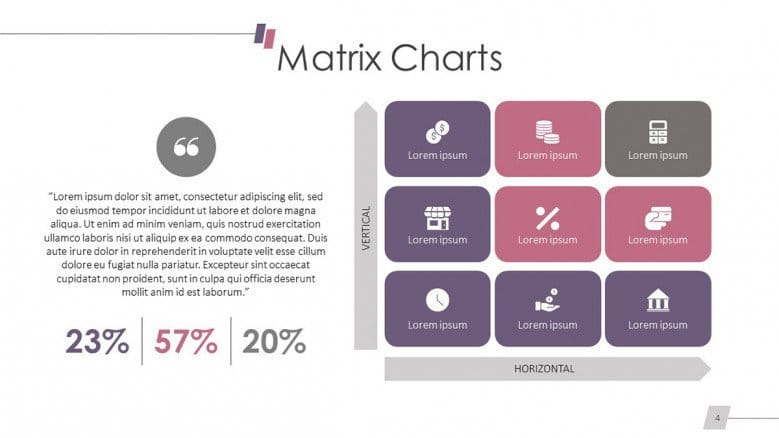
A matrix chart allows you to compare and analyze different sets of data. You can use it to prove certain data sets are related. Plus, you can even show the strength of that relationship.
Download our 8 matrix models for free now!
6. Stair Diagram PowerPoint Template
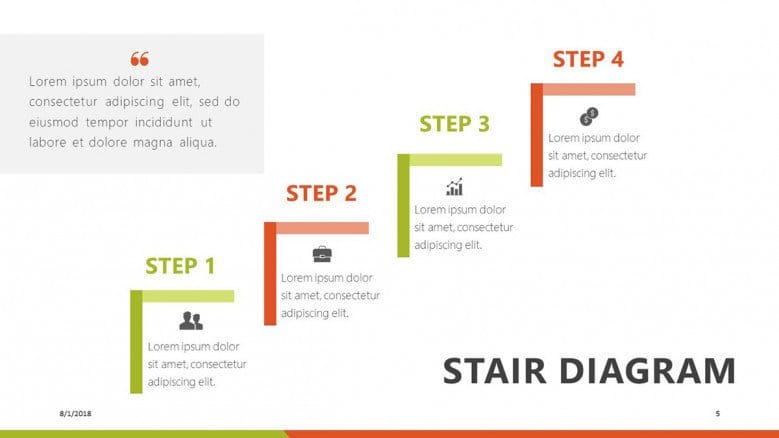
Like their namesake, stair diagrams show steps or progression in data presentations. You can use good, old-fashioned bullet points, but it won’t be much fun.
This template offers 10 stair diagrams; the screenshot above shows a steps stair diagram. Explore all of them for free!
7. Tables PowerPoint Template
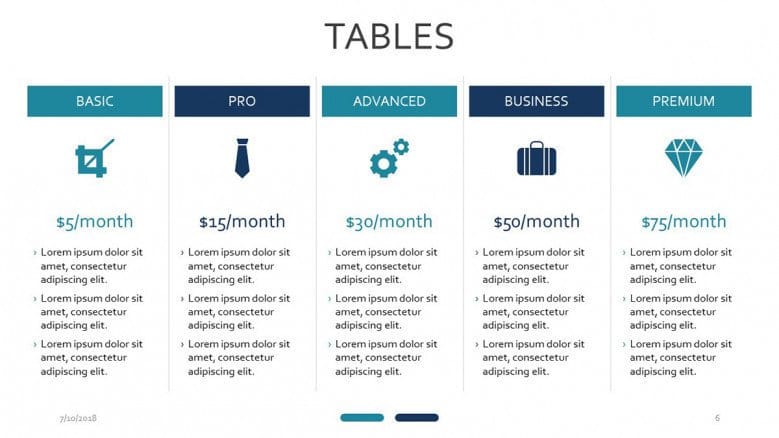
Tables have been a staple in data visualization for a long time, and we believe they continue to be widely used today. Despite the evolution of various visualization tools and techniques, tables remain a fundamental way to present data clearly and effectively.
This template pack offers standard table slides as well as creative designs, including a subscription slide, a table with different symbols, and a matrix organizational structure. Choose your favorite based on your needs!
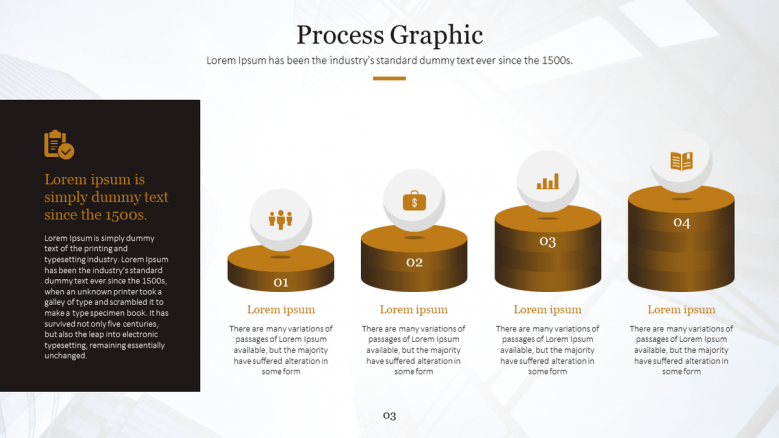
8. Flow Chart PowerPoint Template
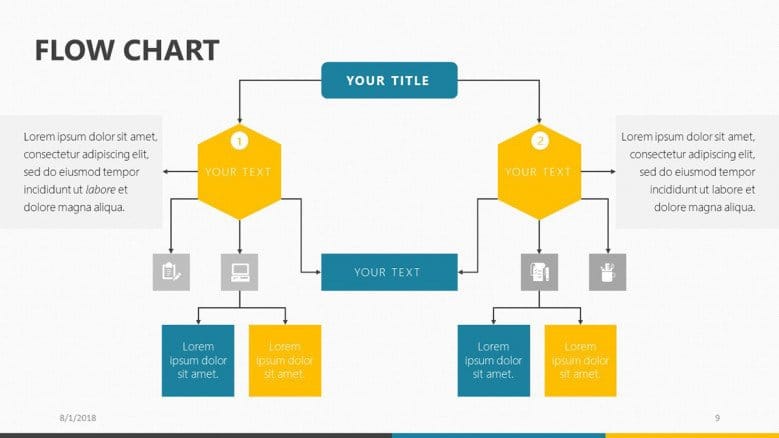
Flowcharts are handy for documenting specific company procedures. They can even present the company hierarchy and who is responsible for certain tasks.
Instead of verbally discussing processes, why not try using a flowchart?
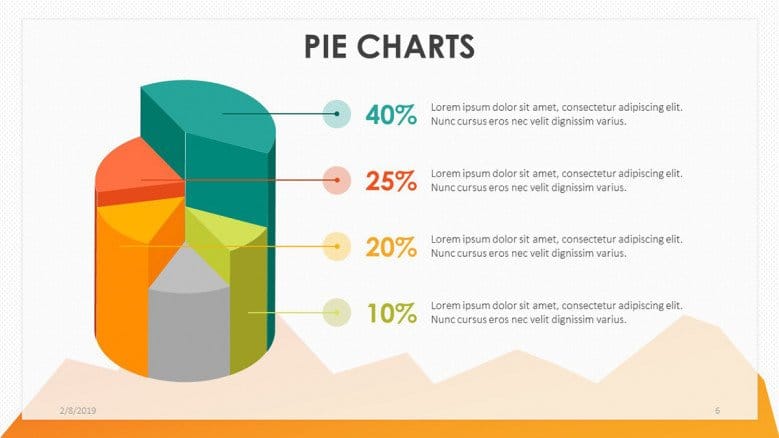
9. Financial Pie Graphs PowerPoint Template
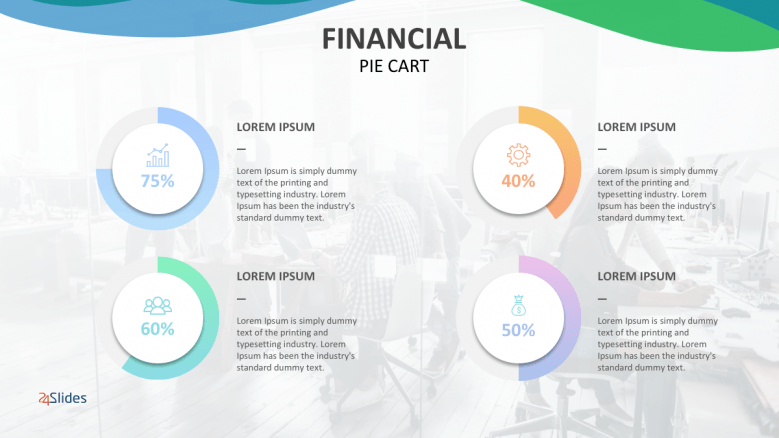
Whether you’re presenting in front of the directors of your company or potential investors for your startup, these radial charts will help you get your point across. With a few clicks, you can customize these resources and make them your own!
This data visualization template includes 3 slides: a financial pie chart for comparison (shown above), a ring pie chart, and a doughnut pie chart slide.
10. Research and Development Data PowerPoint Template
Every successful startup needs a solid research and development (R&D) process, which can be lengthy and costly and often require external funding.
This template pack is designed to help you create a concise, impactful presentation for potential investors. Remember, while design is important, your passion and persuasive skills will ultimately drive your success in a data presentation!
11. Sales Report PowerPoint Template
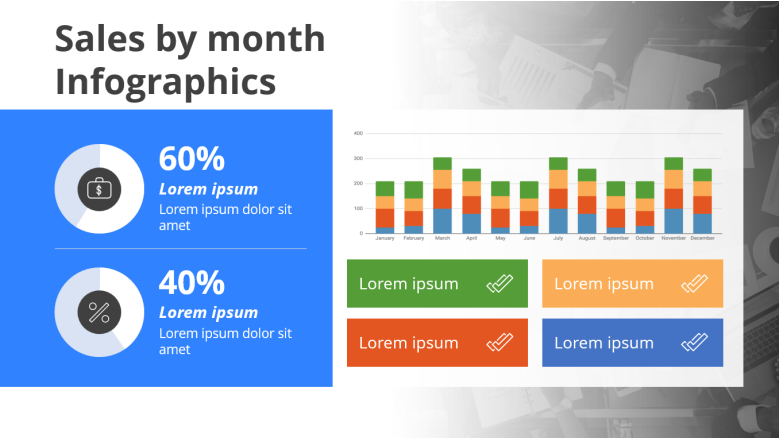
Our list of data presentation templates wouldn’t be complete without a sales report template in PowerPoint.
This pack includes sales bar charts, line charts, radial charts, sales data visualization sections, and annual sales report slides. Everything you need in one presentation deck!
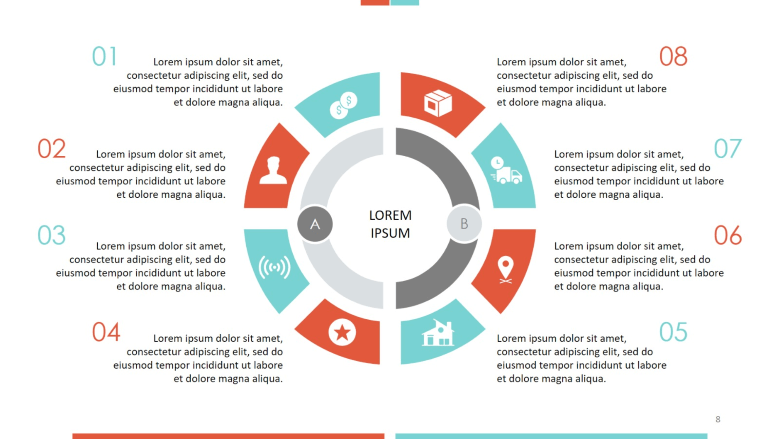
12. Data-Driven PowerPoint Template
This 9-slide template pack contains charts and diagrams for your business presentations or any project you lead.
With its thoughtful design and diverse range of graphs, this template is perfect for most financial presentations. So, what are you waiting for? Check out our template pack now!
13. Block Chain Data PowerPoint Template
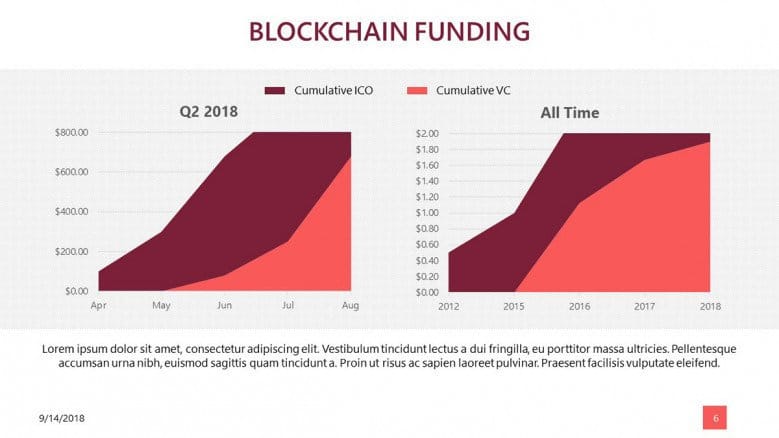
Cryptocurrency and blockchain are all the rage nowadays. Many people became millionaires overnight, but many more gambled and lost their entire life savings!
Don’t get left behind and explore more about digital currencies with our free template pack.
Google Slides Templates for Your Data Presentations
PowerPoint is awesome, but Google Slides is also a brilliant tool. If you haven’t used this platform, this is your signal to start doing so. Unlock the potential of your data with our free templates, crafted to transform your slides into stunning visual stories!
With Google Slides templates, there’s no need to download anything to your computer. Simply create an account on our Templates Repository and make a copy of the template. As you can imagine, editing it will be a breeze!
1. Corporate Data Presentation in Google Slides
Our Google Slides template provides essential charts for data presentation, including bar charts, pie charts, and line charts.
The best part? Each chart is linked to a Google Sheets spreadsheet, giving you complete control over the data.
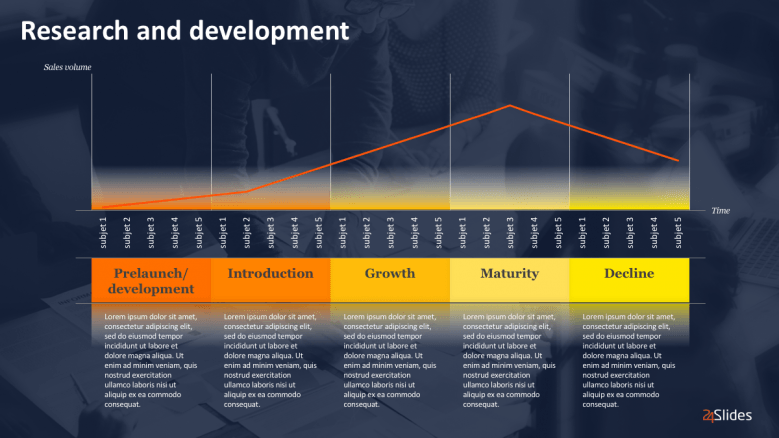
2. Life Cycle Diagram in Google Slides
A product’s life cycle—spanning from introduction to growth, maturity, and decline—directly influences your company's marketing and pricing strategies. So, you have to know how to monitor each stage.
This template pack includes a summary slide to introduce your objectives and guide the audience. It also features an area chart to visually represent product growth over time, helping to clarify the current stage. See it yourself by clicking on the title!
3. Playful Pie Chart in Google Slides
Unlike the other pie charts in this article, this one will be straightforward to use. You’ve got 8 pie chart slides to choose from, including 3D and 2D pie charts in Google Slides.
Choose the ones that best convey your message, then edit and present them!
4. Dashboard Template in Google Slides
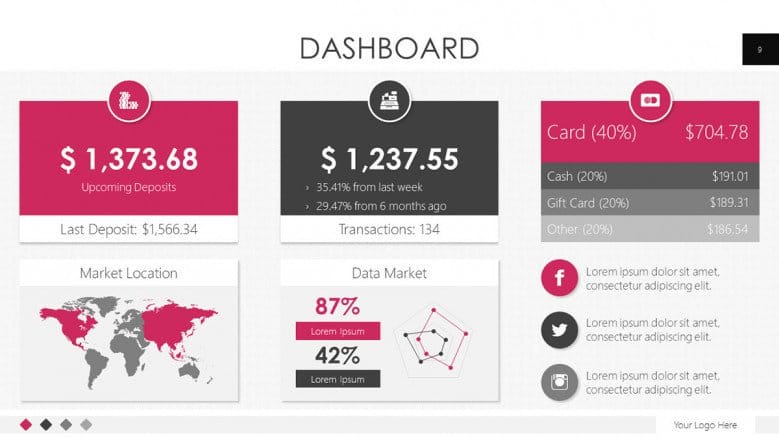
A dashboard slide can convey everything your audience needs in just one slide. While you can use separate slides for each chart, it won’t have the same impact as a dashboard (as you can see in the image).
Dashboard templates are perfect for elevator pitches because they are highly eye-catching. Explore the designs we’ve prepared for you!
5. Waterfall Diagram Template in Google Slides
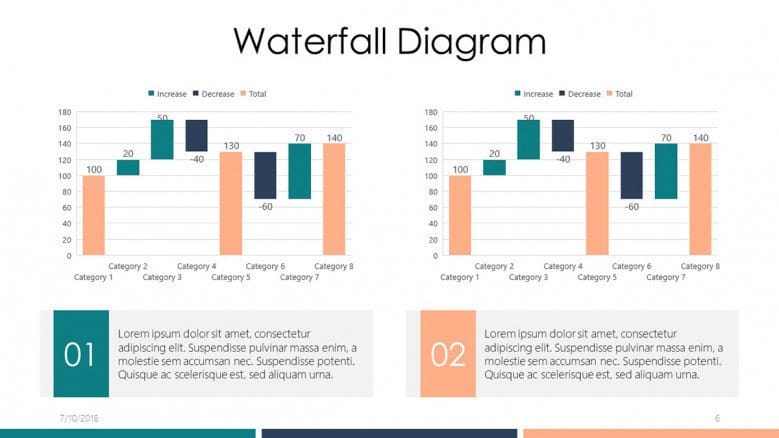
Waterfall charts are excellent for financial presentations, allowing you to show gains or losses over time. They are also helpful in demonstrating changes in cash flow or stock market performance.
This template pack includes a waterfall performance comparison slide (pictured), a basic waterfall diagram, a project timeline slide, and more. Download all for free!
6. Playful Data-Driven Template in Google Slides
Do you think data presentation templates have to be serious? Think again!
This 10-slide playful template is packed with various charts and graphs, including bar graphs, radar charts, waterfall statistics, treemaps, and more. Log in to our Template Repository to download this free Google Slides template.
7. Circle Diagrams in Google Slides
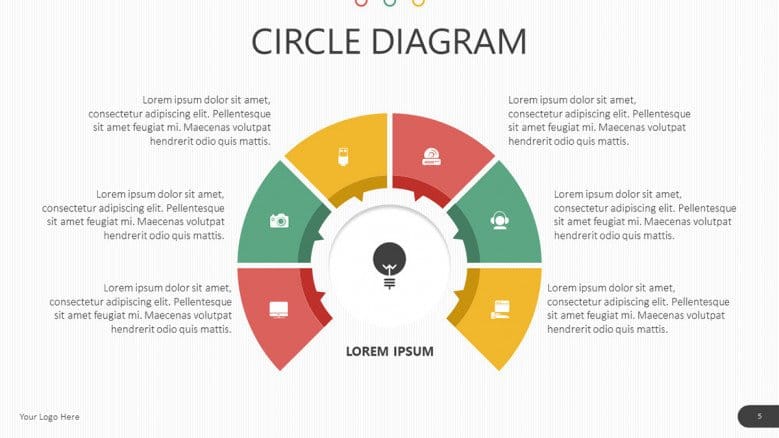
This template pack features 8 types of circle charts in Google Slides, including pie charts, timelines, cyclical processes, project management charts, and Venn diagrams.
The design is both playful and professional, making it suitable for any audience!
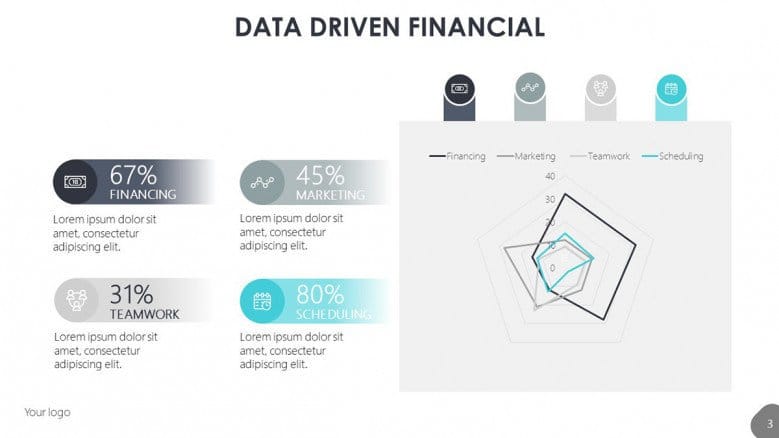
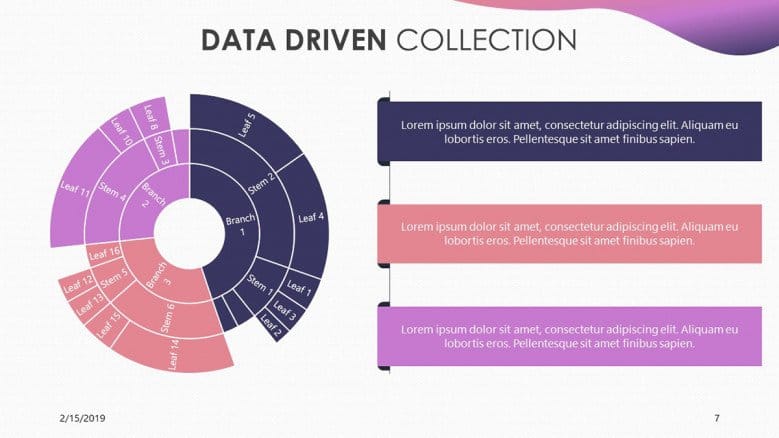
8. Creative Data-Driven and Financial Charts in Google Slides
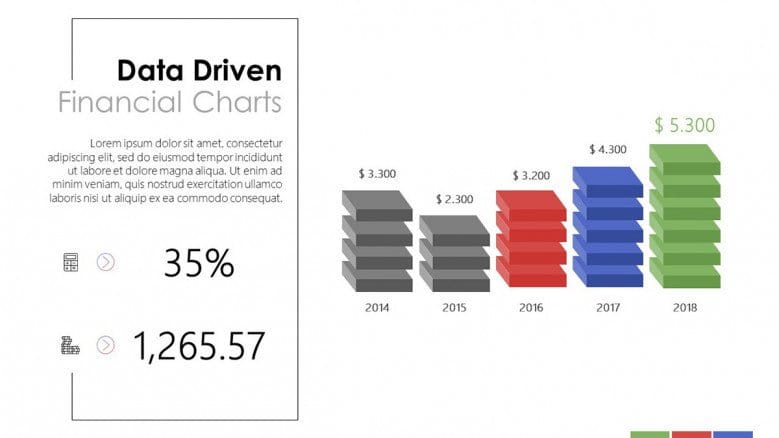
Number crunchers will love the clean design of these 7 data-driven slides. With ample white space and visually appealing graphics, it will help your audience grasp complex financial information.
You only need to replace the placeholder content with your own information and practice your data presentation for the best results!
9. Graph, Diagram, and Data Sheet Presentation in Google Slides
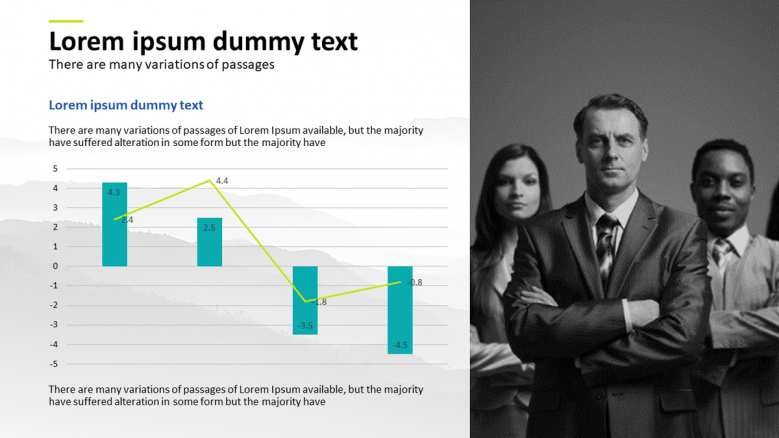
This pack of 5 Google Slides templates includes a versatile collection of charts and diagrams, perfect for any presentation.
Remember that each chart is fully customizable to meet your specific needs. Download this data visualization pack for free today!
10. SWOT Presentation Templates in Google Slides
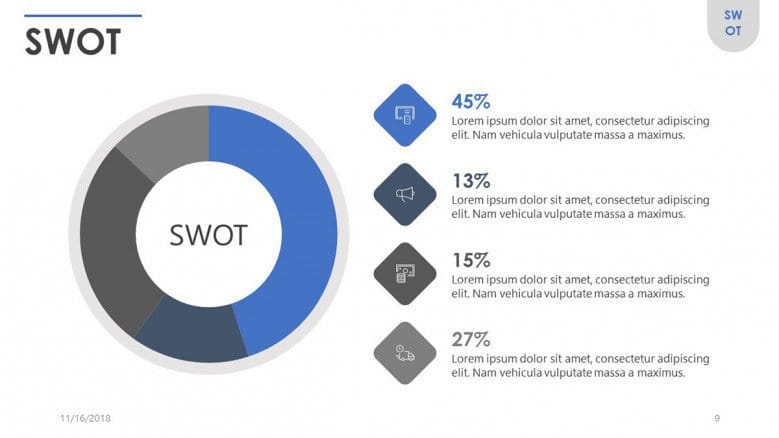
Data visualization isn’t just for numbers; it also includes qualitative data. If you need to present a SWOT analysis, these templates are your go-to solution.
With 8 pre-designed SWOT diagrams, you can easily create impactful presentations. Best of all, they’re free to download—what are you waiting for?
11. ICO Presentation Template in Google Slides
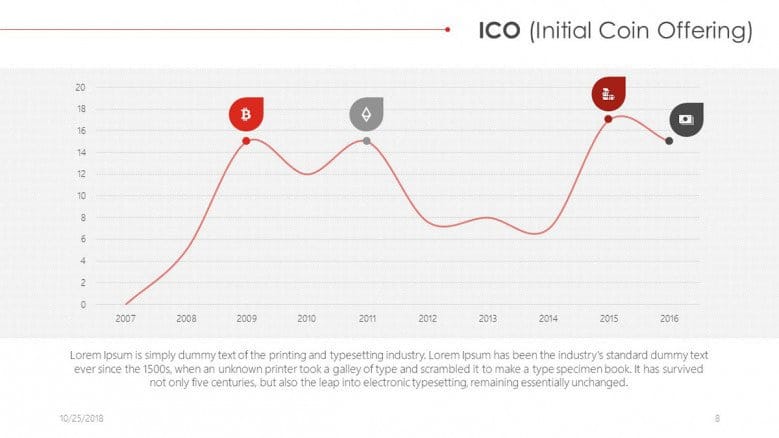
Planning to present an Initial Coin Offering (ICO) for your company or startup? 24Slides has you covered.
We’ve designed this data presentation template with the unpredictable nature of digital currencies in mind, featuring a chart that helps you clearly explain all the details to your audience.
12. Budget Presentation Template in Google Slides
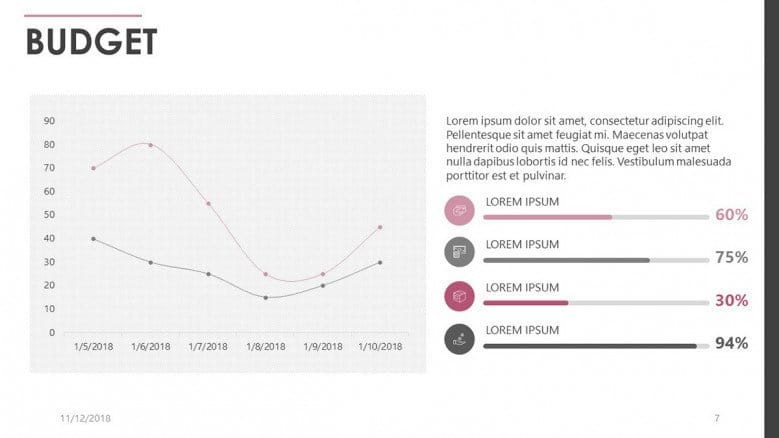
Presenting a project’s budget doesn’t have to be boring!
This resource offers 8 different diagrams in Google Slides, making it easy to streamline your design process. Download our data visualization pack for free now!
13. Financial Template Pack in Google Slides
You should know that effective financial management is crucial to every business’s success. So why not showcase that professionalism in your financial slides?
Explore this final Google Slides template pack and impress your audience with professional and polished data slides!
I hope these 20+ free PowerPoint and Google Slides templates for data presentations are helpful for any project you have in mind. Our templates are designed to be visually attractive while maintaining a professional look. Follow us and stay tuned for all the content we’ve prepared for you!
Where can you find the best templates for FREE?
In 2024, it’s no mystery that there are various ways to optimize your time when designing presentations. One of the most effective methods is using pre-designed templates, and of course, 24Slides has its own repository.
When you enter our Template Repository, you’ll find data visualization templates, marketing templates, portfolio templates, planning templates, and much more!
It’s time to work smart, begin today.

If you like this content, you should check:
- 20+ Self Introduction PowerPoint Templates: Download for free!
- 10+ Consulting Presentation Templates to Impress Clients and Win Proposals
- The Ultimate Brand Identity Presentation Guide [FREE PPT Template]
- How to Make a PowerPoint Template (Tutorial with Pictures!)
- 11 Time-Saving PowerPoint Hacks for Creating Quick Presentations